Have you ever heard of Application Insights? It's basically a monitoring service for developers. You can integrate it into your own applications and the results are some very nice charts. You can even build your own dashboard. There are quite a lot of different SDKs for the most popular languages. Wouldn't it be nice to have your scheduled PowerShell scripts monitored as well? Sadly there's currently no specific SDK for PowerShell. But it's actually quite easy to use the .Net SDK in PowerShell.
Create Application Insights resource in Azure
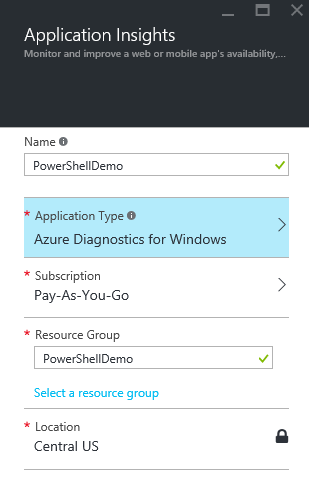
Go to https://portal.azure.com and create a new Application Insights resource. There is almost no configuration required.
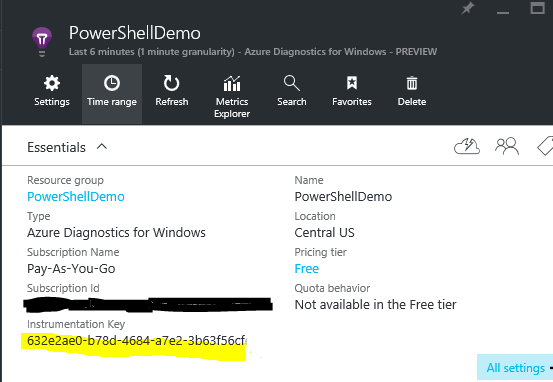
when the AI resource is created you'll get the following information. The most important part is the instrumentation key. This is the key which identifies this resource and PowerShell will need this key to send the tracking information.

PowerShell integration
Now that everything is setup to collect the information we need to actually generate some data. In a first step we need to load the corresponding assembly from the NuGet package. For this you need the .nupkg from the following link: https://www.nuget.org/api/v2/package/Microsoft.ApplicationInsights/1.2.3
nupkg is just a renamed zip-file. So we can rename it to microsoft.applicationinsights.1.2.3.zip and extract the data. There are a couple of different files for different platforms. In this example we're going to use \lib\net45\Microsoft.ApplicationInsights.dll.
With the following code you can initialize a TelemetryClient which will interact with the Application Insights backend. To send the data to correct AI resource you need to set it to the correct instrumentation key (the one we got above by creating the resource).
$AI = "$PSScriptRoot\Microsoft.ApplicationInsights.dll"
[Reflection.Assembly]::LoadFile($AI)

$InstrumentationKey = "d6a7f123-4567-4630-9da0-54f82d4a39c8"
$TelClient = New-Object "Microsoft.ApplicationInsights.TelemetryClient"
$TelClient.InstrumentationKey = $InstrumentationKey
There are a couple of ways to send information to the backend. The most basic one is a generic event TrackEvent(String). It allows to send any string. After we tracked the event we have a Flush() command. This forces the TelemetryClient to send data to backend immediately. Otherwise the client will collect data for approximately one minute send send it then as a bulk job. If the PowerShell process closes before sending the data you won't be able to see anything in the AI portal. So use a Flush() command to be sure we
# Event
$TelClient.TrackEvent("PowerShell rocks!")
$TelClient.Flush()
for advanced data collection we can use TrackMetric(MetricTelemetry). This allows to track a value for a specific metric/counter. This allows to display charts where you can see how your script performed over a period of time.
# Metric
$TrackMetric = New-Object "Microsoft.ApplicationInsights.DataContracts.MetricTelemetry"
$TrackMetric.Name = "Powershell"
$TrackMetric.Value = 12
$TelClient.TrackMetric($TrackMetric)
$TelClient.Flush()
And one of my favorite features is the tracking of exceptions. Isn't that what we are the most interested about? It's not that different from the other tracking methods. You can use TrackException() and it takes a ExceptionTelemetry object as argument.
The following snipped forces a DivideByZeroException which is caught and reported to AI.
# Exception
try {
    8/0 #DivideByZeroException
}
catch {
    $TelException = New-Object "Microsoft.ApplicationInsights.DataContracts.ExceptionTelemetry"
    $TelException.Exception = $_.Exception
    $TelClient.TrackException($TelException)
    $TelClient.Flush()
}
visualize the data
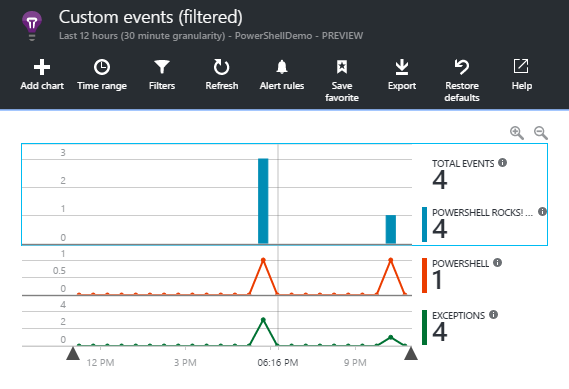
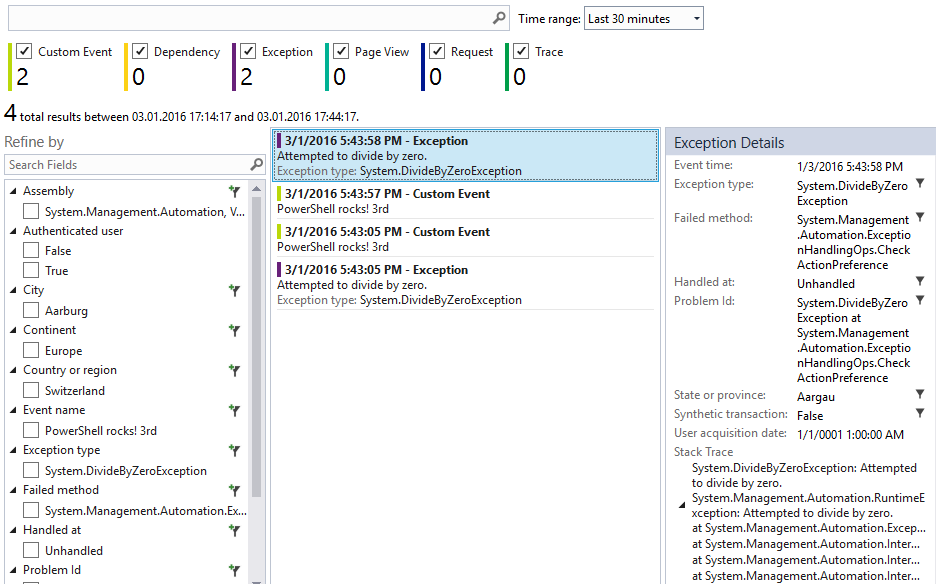
if you don't want to look at the data in the azure portal there's also a way to see those data in Visual Studio 2015 Community (Free)
Just go to: View > other Windows > Application Insights Search
it looks like this:
there are a lot of ways you can use this data. In the future I'll do some more blog posts about advanced scenarios. check back!


